|
|
|
|
|
|
|
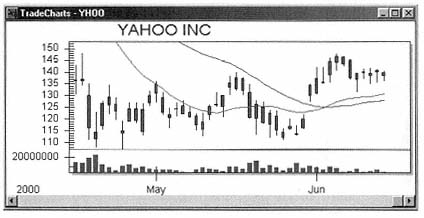
charting packages that allow you to display charts, as shown in Figure 6.8, in various formats, in selected time periods, and with a range of chart studies. |
|
|
|
|
|
|
|
|
Figure 6.8
Sample Real-Time Chart
Copyright 2000, TradeCast® Ltd. |
|
|
|
|
|
|
|
|
As shown in Figure 6.9, this comprehensive display tool shows you selected data on a group of chosen stocks and indexes you like to watch. For example, you might create a real-time display of last price, yesterday's close, change from close, today's open, change from open, and volume. All of these can be valuable indicators to the prepared trader. |
|
|
|
|
|
|
|
|
Another aid for choosing stocks to trade is a window that will display, in real-time, a list of the top ten in such categories as: volume, gainers, losers, percentage gainers, percentage losers, etc., as shown in Figure 6.10. |
|
|
|
|
|